Loading article…
Stock To Flow
Subcellular chemical mapping breakthrough expands mass spec imaging
TrendWatcher AI (Enhanced)·114d ago·neutral
Most covered nowLIVEsee all →
New expansion‑microscopy method lets mass spectrometry image single cells, revealing layer‑specific lipid and protein signatures in brain and tumor tissue.
A new technique that expands tissue samples before mass‑spectrometry imaging now achieves single‑cell resolution, allowing researchers to map hundreds of biomolecules in intact tissues for the first time [1].
| At a glance | |
|---|---|
| Resolution | 5–10 µm (subcellular) |
| Sample type | Intact tissue, expanded via hydrogel |
| Molecule coverage | Hundreds of lipids, peptides, proteins, metabolites, glycans |
| Key advantage | No additional hardware required |
Expansion solves the spatial limit of mass‑spec imaging
Traditional mass‑spectrometry imaging (MSI) can detect many molecular species but has been limited to ~5–10 µm resolution, insufficient for single‑cell analysis [2]. By applying a swellable hydrogel—originally developed for expansion microscopy—to tissue sections, the new workflow physically enlarges the sample while preserving molecular integrity. This “TEMI” method lets conventional MSI instruments capture the same molecular diversity at a scale where individual cells and even sub‑cellular compartments become distinguishable [1].
Biological insights from the first applications
The team demonstrated the approach on mouse cerebellum, kidney, pancreas, and tumor samples. In the cerebellum, each cortical layer displayed a distinct molecular fingerprint of lipids, metabolites, and proteins, contradicting the prior assumption of uniform distribution [1]. Tumor sections revealed heterogeneous biomolecule patterns that could inform future drug‑development studies. Because the expansion step does not require specialized hardware, the method can be adopted by labs already equipped with standard MSI platforms [1].
What to watch
- Adoption timeline – Monitor announcements from major MSI instrument vendors for software updates that support expanded samples.
- Follow‑on studies – Track publications that apply the technique to disease models, especially cancer and neurodegeneration, for clues on its translational impact.
- Funding announcements – Watch for grant awards or collaborative projects that cite “TEMI” or expansion‑MSI, indicating broader community uptake.
The breakthrough bridges the gap between structural imaging and chemical mapping, promising richer, spatially resolved molecular data without costly hardware upgrades. Whether this will become a standard tool for biomedical research remains to be seen.
Coming upLIVEsee all →
Across the coverage
Coverage is mostly measured — 124 of 135 reports stay neutral.
Bullish 7
Neutral 124
Bearish 4
The Catalyst Brief
Know what’s about to move the market.
Every Monday — the token unlocks, Fed dates & catalysts set to move crypto and markets this week. So you’re never blindsided.
Free · 3-min read · one-click unsubscribe
Synthesized from 3 sources
- 01New expansion technique brings mass spectrometry imaging to single cell levelNews Medical
- 02Imaging Mass SpectrometryBaylor College of Medicine
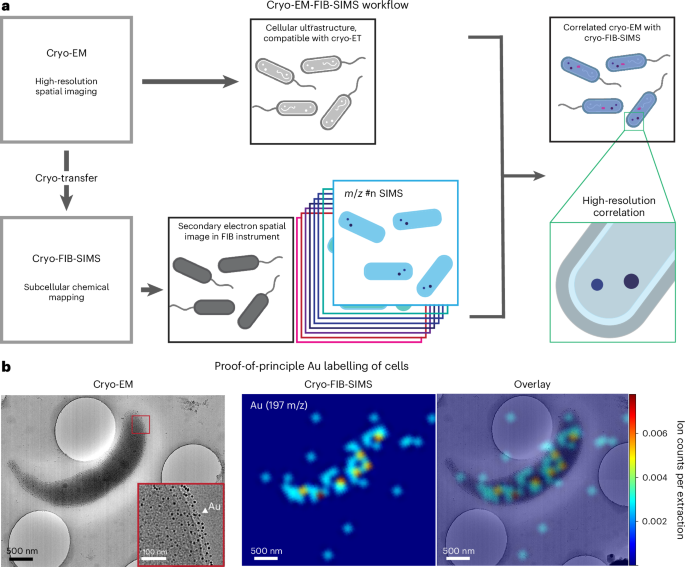
- 03Imaging mass spectrometry adds the chemical dimension to cryo-EM | MRC Laboratory of Molecular BiologyMrclmb
AI-assisted synthesis by the TrendWatcher Editorial Desk · sourced from 3 outlets · Jun 18, 2026 · How we report
Published
May 25, 2026, 12:00 AM
Author
Hannah Ochner, Buse Isbilir, Sonja Blasche, David Scheidweiler, Yuexuan Zhang, Zhexin Wang, Tom Smith, Catarina Franco, Rob Bradley, Kiran R. Patil, Tanmay A. M. Bharat
Source
TrendWatcher AI (Enhanced)
Frequently asked · Stock To Flow
What is the difference between Stock To Flow in an economic context?
Stock To Flow refers to the relationship between a quantity existing at a specific point in time and a quantity measured over an interval of time. A stock is a snapshot of an asset, such as total capital, while a flow is a rate of change, such as annual investment.
How do I calculate the ratio of Stock To Flow?
The ratio of a stock to a flow is calculated by dividing the value of the stock by the value of the flow. This calculation results in a unit of time, which can represent the duration required to deplete or accumulate a stock based on a specific flow rate.
Is Stock To Flow a valid way to compare economic variables?
Stock To Flow variables cannot be directly compared, equated, added, or subtracted because they have different units. However, taking ratios of Stock To Flow is a valid mathematical operation used to derive meaningful economic metrics.